Estity.
Estity.
Redesigning user onboarding using cognitive science to minimize drop-off and boost usability.
Redesigning user onboarding using cognitive science to minimize drop-off and boost usability.
OVERVIEW
OVERVIEW
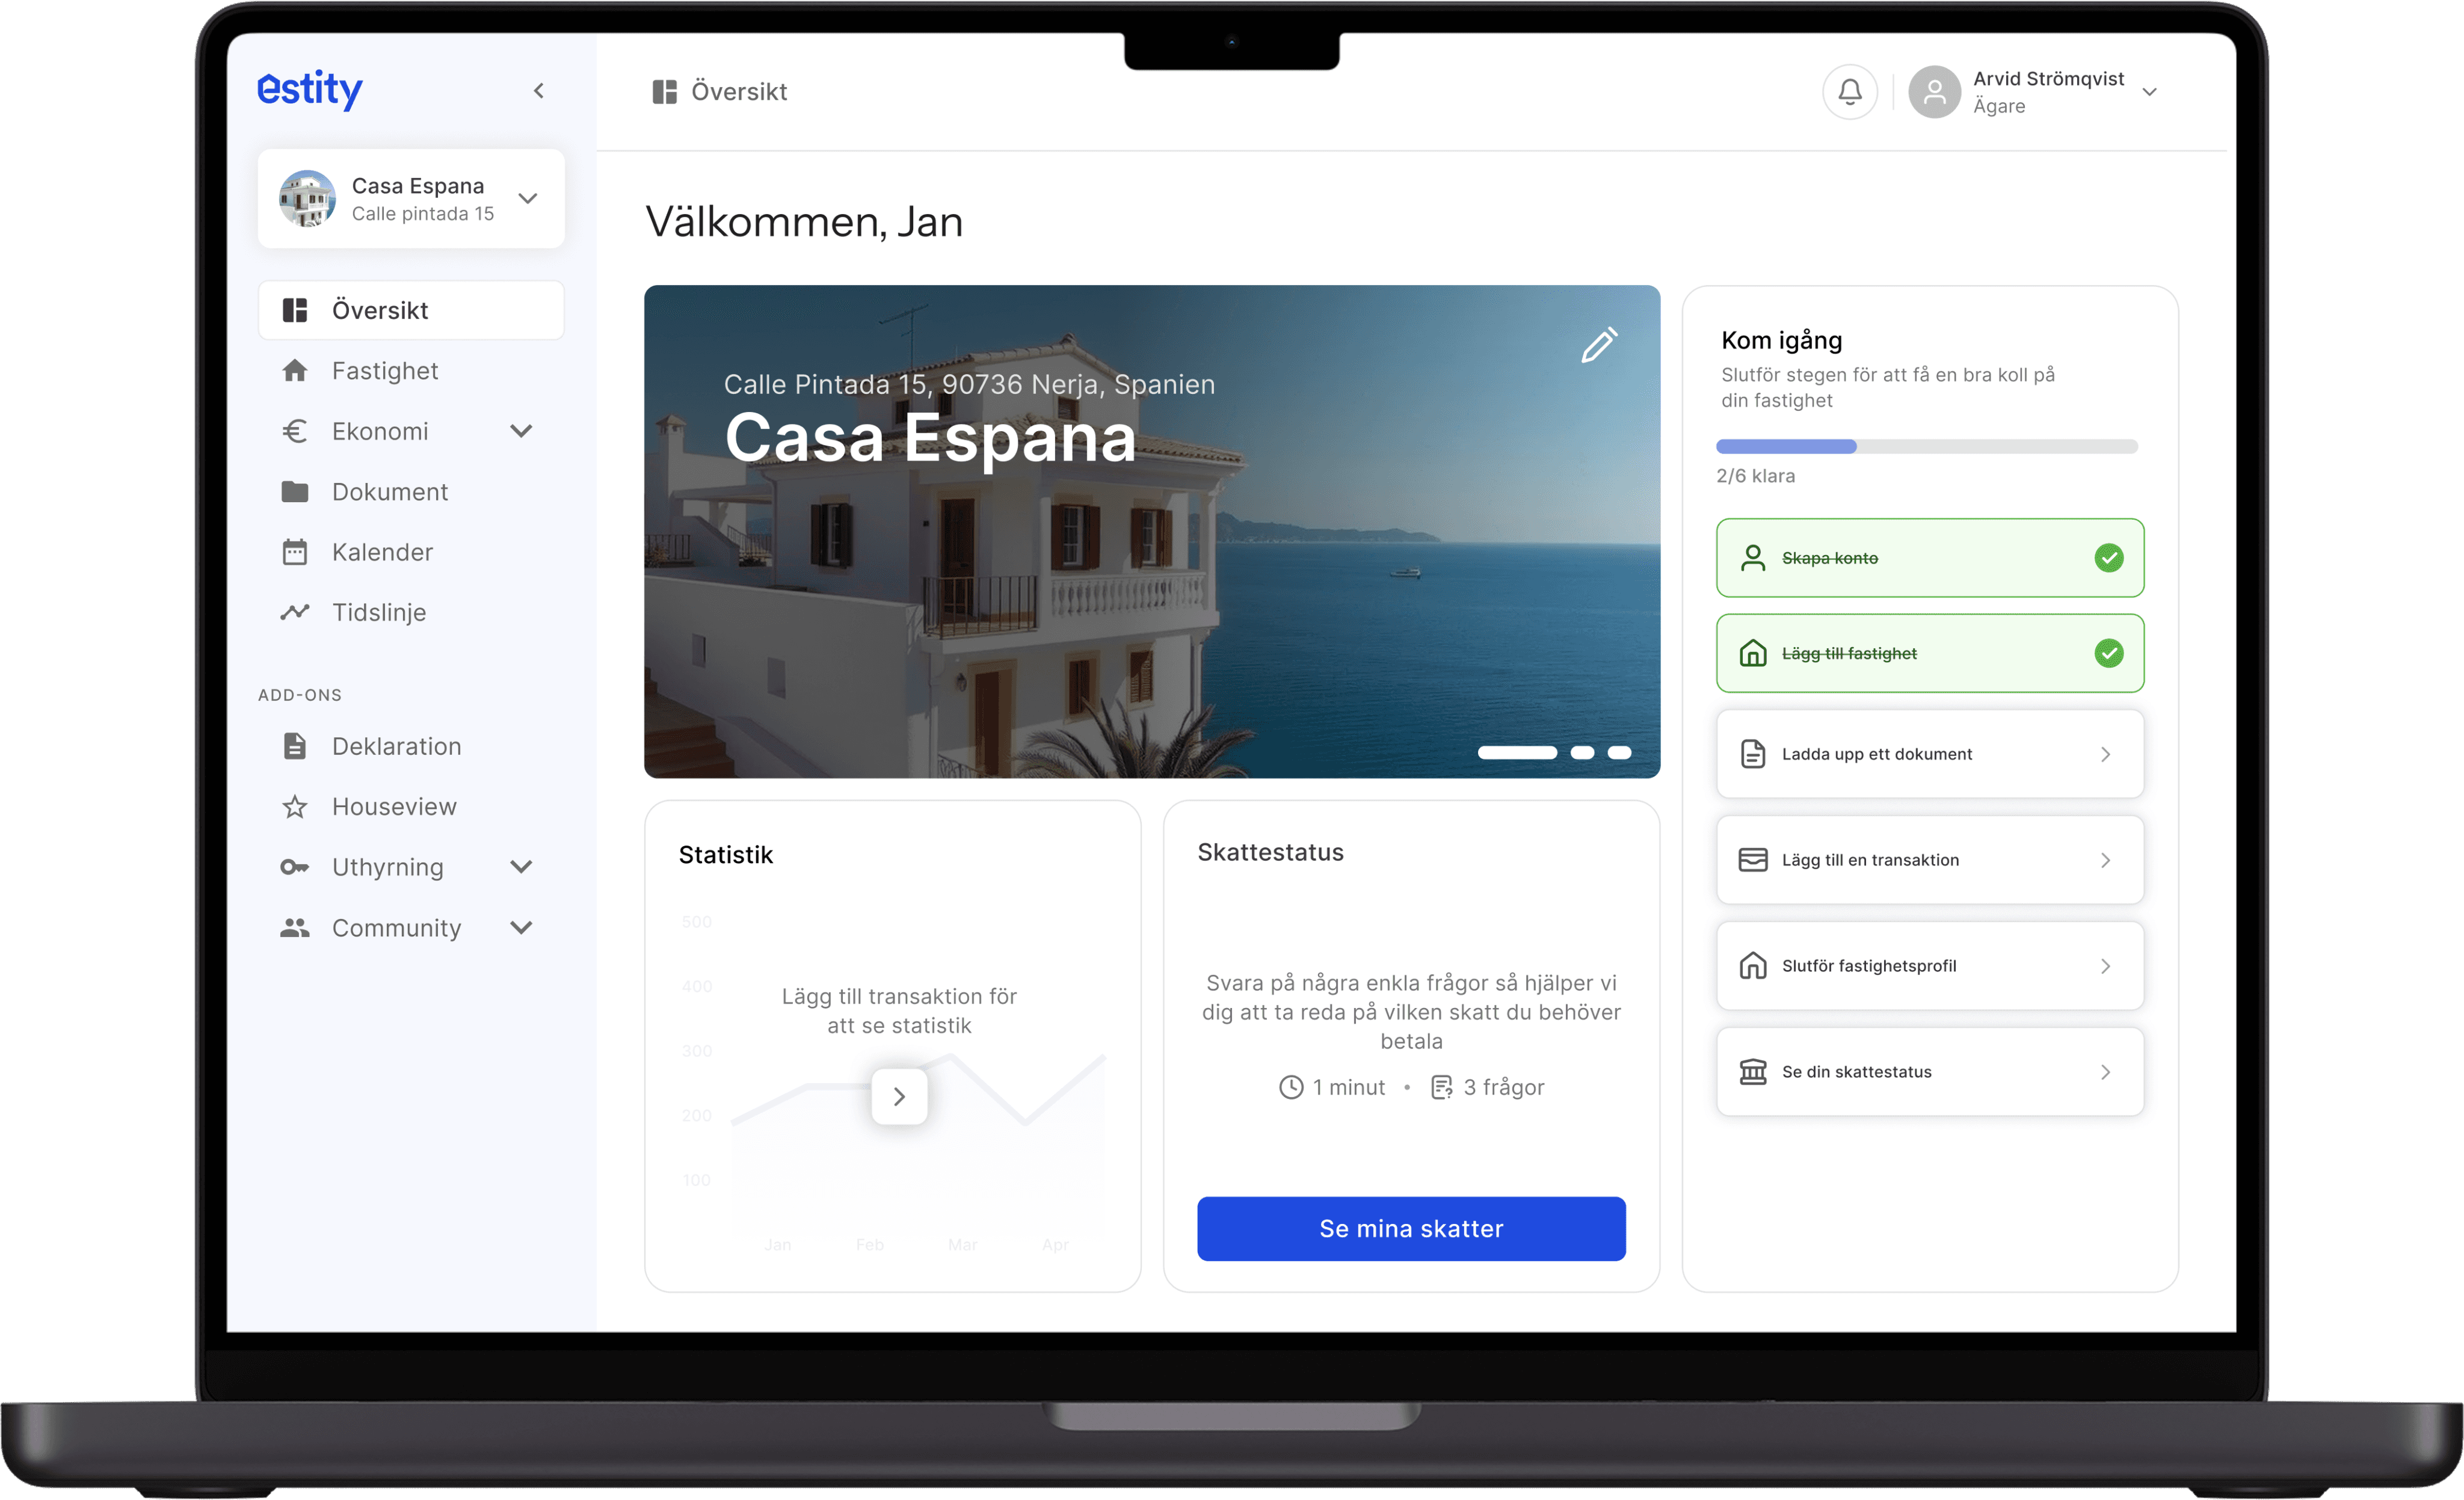
Estity helps Swedish homeowners manage their Spanish properties. Due to onboarding friction and lost conversions, we combined cognitive theory with user testing to redesign the platform in Figma, improving the experience for first-time users.
Estity helps Swedish homeowners manage their Spanish properties. Due to onboarding friction and lost conversions, we combined cognitive theory with user testing to redesign the platform in Figma, improving the experience for first-time users.
Role
UX/UI Designer
Timeline
8 weeks
Project
Bachelor thesis
RESEARCH
Literature Review: An exploratory research phase to optimize onboarding from a cognitive perspective.
Literature Review: An exploratory research phase to optimize onboarding from a cognitive perspective.
Usability Testing: Semi-structured user interviews combined with usability testing and Likert-scale quantitative metrics.
Usability Testing: Semi-structured user interviews combined with usability testing and Likert-scale quantitative metrics.
Heuristic Evaluation: A comprehensive audit grounded in Jakob Nielsen’s 10 Usability Heuristics to identify hidden usability problems.
Heuristic Evaluation: A comprehensive audit grounded in Jakob Nielsen’s 10 Usability Heuristics to identify hidden usability problems.
PROBLEMS
Static Flow: The onboarding didn't adapt to different use cases (like personal vs. rental properties).
Static Flow: The onboarding didn't adapt to different use cases (like personal vs. rental properties).
Tax Complexity: Spanish tax rules were presented with limited context, making it difficult for users to confidently select the correct declaration type.
Information Deficits & Cognitive Overload: Complex Spanish tax laws were presented without contextual guidance forcing users to rely heavily on working memory and prior knowledge.
Ineffective navigation: Inconsistent empty-states, collapsed sidebar and a broken back-button created unnecessary cognitive load.
Ineffective navigation: Inconsistent empty-states, collapsed sidebar and a broken back-button created unnecessary cognitive load.
DESIGN SOLUTIONS
DESIGN SOLUTIONS
DESIGN SOLUTIONS
Questionnaire Onboarding Setup
Questionnaire Onboarding Setup
Two large choices per screen which reduces decision and click time.
Two large choices per screen which reduces decision and click time.

Progressive Disclosure
Progressive Disclosure
Key summaries first with expandable details on demand, reducing clutter.
Key summaries first with expandable details on demand, reducing clutter.

Pop-Out Effect
Pop-Out Effect
Limiting the number of primary CTA:s, making it instantly recognizable
Limiting the number of primary CTA:s, making it instantly recognizable

Endowed Progress & Goal-Gradient Effect
Visually pre-marking already completed tasks, increasing motivation to complete remaining steps.

Endowed Progress & Goal-Gradient Effect
Visually pre-marking already completed tasks, increasing motivation to complete remaining steps.

Affordance & Feedforward
Affordance & Feedforward
Clear explanations and previewing the outcome of the action.
Clear explanations and previewing the outcome of the action.

USABILITY TESTS
We conducted comparative usability testing on the optimized Figma prototype under identical task conditions.
We conducted comparative usability testing on the optimized Figma prototype under identical task conditions.
Time Reduction: Total task completion time decreased from an average of 14.5 minutes down to less than 7 minutes.
Time Reduction: Total task completion time decreased from an average of 14.5 minutes down to less than 7 minutes.
Reduced Misclicks & Effort: Mean total misclicks dropped by over 60% (from 19 to 7,2) and self-reported mental effort (Paas) dropped across every task.
Reduced Misclicks & Effort: Mean total misclicks dropped by over 60% (from 19 to 7,2) and self-reported mental effort (Paas) dropped across every task.
SUS-score: The total System Usability Scale (SUS) score went from 67.00 (Below average) to 86.50 (above average).
SUS-score: The total System Usability Scale (SUS) score went from 67.00 (Below average) to 86.50 (above average).
OUTCOME
Better Usability: Improved the platform's System Usability Scale (SUS) rating from a below-average 67.0, to an excellent rating of 86.5.
Better Usability: Improved the platform's System Usability Scale (SUS) rating from a below-average 67.0, to an excellent rating of 86.5.
Less Decision Anxiety: Improved user confidence in selecting correct property tax types and elevated understanding of core platform features,
Less Decision Anxiety: Improved user confidence in selecting correct property tax types and elevated understanding of core platform features,
Smooth Navigation: Leveraged feedforward and clear affordances for smooth navigation.
Smooth Navigation: Leveraged feedforward and clear affordances for smooth navigation.
Deliverables: A fully validated interactive Figma prototype alongside a comprehensive thesis was delivered to Estity for implementation.
Deliverables: A fully validated interactive Figma prototype alongside a comprehensive thesis was delivered to Estity for implementation.


